
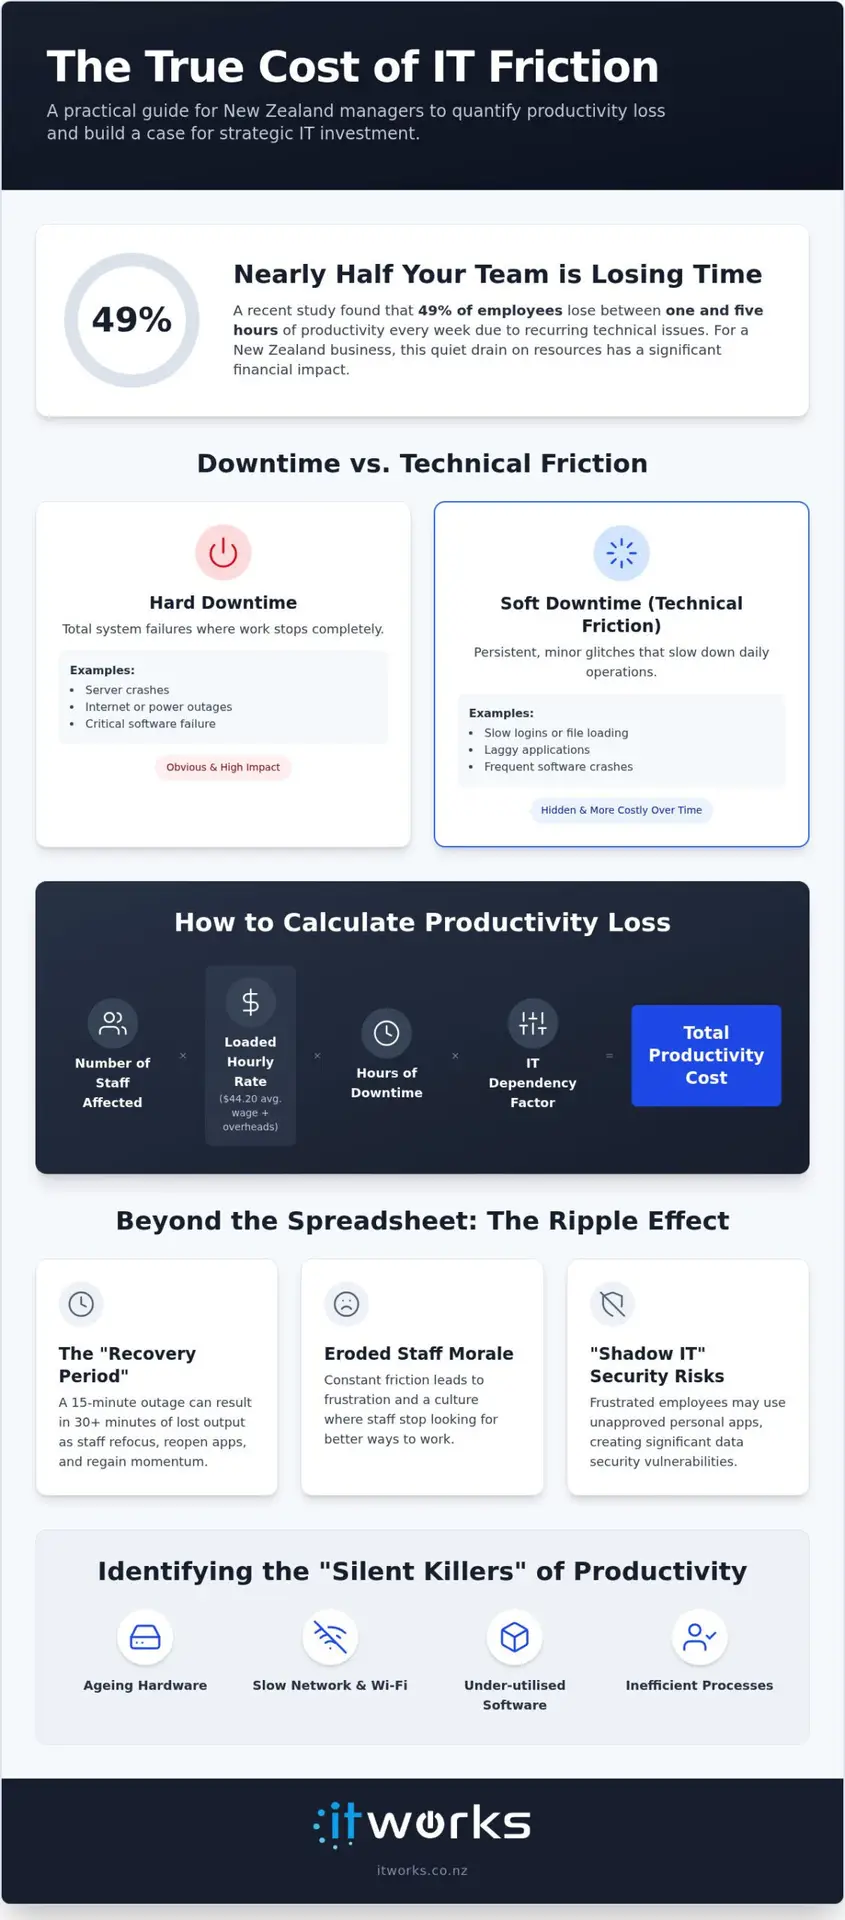
Did you know that 49% of employees lose between one and five hours of productivity every single week due to recurring technical glitches? For a New Zealand manager, these “minor” interruptions often feel like a background noise you’ve simply learned to live with. However, when you stop to consider the 2026 average hourly wage of $44.20, those lost moments quickly compound into a significant financial drain that stays hidden from your balance sheet. It’s incredibly frustrating to watch your team’s momentum stall because of a slow network or a faulty login, yet justifying the budget to fix these issues remains a challenge without hard data.
The good news is that you don’t have to rely on guesswork any longer. This guide will show you exactly how to calculate productivity loss from IT issues using proven frameworks like the Human Capital Approach. We’ll provide the specific formulas you need to quantify the cost of downtime and technical friction, including how to factor in your specific overhead rates for a more accurate total. By the end of this article, you’ll have a clear dollar figure to present in your next budget meeting and a strategic roadmap to move your organisation from reactive fixing to proactive, sustainable growth.
Key Takeaways
- Learn to distinguish between total system failures and the subtle performance friction that quietly erodes your team’s output every day.
- Master a practical framework for how to calculate productivity loss from IT issues by combining staff wage data with your organisation’s specific overhead rates.
- Identify the “silent killers” of efficiency, such as the compounding costs of ageing hardware and the under-utilised features within your Microsoft 365 environment.
- Understand how to factor in the ripple effect and opportunity costs that occur when technical bottlenecks prevent your team from focusing on high-value strategic work.
- Discover how to move from reactive troubleshooting to a proactive strategy that aligns your technology investment with long-term business goals.
Understanding the True Impact of IT Friction on Your Bottom Line
IT productivity loss isn’t just about the moments your internet goes dark or a server fails. It’s the silent gap between what your team could achieve and what they actually deliver when technology gets in the way. While a total system outage is easy to spot, the real damage often comes from “technical friction”, the persistent, minor glitches that slow down daily operations. For many managers, understanding the productivity paradox is a vital first step in recognising why big tech spends don’t always result in faster workflows.
When you look at how to calculate productivity loss from IT issues, it’s helpful to distinguish between “hard downtime” and “soft downtime”. Hard downtime is a total failure where work stops completely. Soft downtime, or performance degradation, is far more insidious. It’s the five minutes wasted every morning on a slow login, the lag when opening a large file, or the repetitive crashing of a specific application. Because these issues feel “minor”, they often go unreported, yet they occur far more frequently than major outages, making them significantly more expensive over a financial year.
There’s also a heavy psychological cost to consider. Constant technical friction erodes staff morale and breaks the trust your team has in company systems. When a professional spends their day fighting with their tools rather than using them, frustration builds. This leads to a culture of “learned helplessness” where employees stop looking for better ways to work because they assume the technology simply won’t support them.
The Difference Between Downtime and Technical Friction
A slow SharePoint site or a laggy ERP system doesn’t just waste seconds; it shatters focus. Every time an employee waits for a spinning icon, they risk “context switching”, where their brain drifts away from deep work. Once that focus is broken, it can take significant time to return to the original task. Technical friction is the cumulative delay and mental fatigue caused by non-optimised systems that fail to keep pace with a modern workflow.
Why New Zealand Organisations Often Underestimate the Cost
In many Kiwi workplaces, there’s a traditional “she’ll be right” attitude toward ageing hardware. We tend to celebrate the person who finds a “workaround” for a broken process rather than fixing the root cause. This mindset is a financial trap. It leads to the rise of shadow IT, where frustrated staff start using unmanaged personal apps to get their jobs done, creating security risks. In a competitive labour market, providing reliable tools is a key part of staff retention. This principle applies across all sectors; just as an office worker needs a fast laptop, a trade professional relies on specialized gear like painters workwear australia to maintain high standards of efficiency and comfort throughout the day. If your team feels hindered by their equipment, they’ll eventually look for an employer who empowers them with a more seamless environment.
The Step-by-Step Formula for Calculating IT Productivity Loss
Quantifying the financial impact of technical disruptions requires moving beyond gut feelings and into hard data. While many managers realise that tech issues cost money, few have a structured method to present these figures to a board or during budget reviews. Understanding The True Cost Of Downtime involves more than just looking at a clock. It requires a formula that accounts for the specific roles within your New Zealand organisation and the varying ways they interact with technology.
To establish a baseline, you can use this fundamental calculation: (Number of Staff Affected × Loaded Hourly Rate × Hours of Downtime) × IT Dependency Factor. This provides a clear dollar figure for the immediate loss. However, for a truly accurate result, you must also include the “recovery period”. This is the time it takes for staff to reorganise their thoughts, reopen applications, and return to their previous state of deep work once systems are back online. Often, a 15-minute outage results in 30 minutes of actual lost output.
Step 1: Quantifying Affected Labour Costs
Credibility starts with accurate data. When determining how to calculate productivity loss from IT issues, don’t just use a basic salary. You need a “loaded” hourly rate that includes Kiwisaver contributions, insurance, and office overheads. As of early 2026, the average hourly wage in New Zealand is $44.20. When you add standard overheads, the real cost to the business is often significantly higher. Grouping your staff by department allows you to apply different rates and see which areas of the business are the most expensive to leave idle. If you aren’t sure where to start with these calculations, you can talk to IT Works about your technology strategy to get a clearer picture of your operational risks.
Step 2: Applying the IT Dependency Factor
Not every role is equally crippled by a network failure. A data analyst or a remote call centre operator has an IT Dependency Factor of 100%, as they cannot perform their primary duties without a connection. Conversely, a warehouse supervisor or a site manager might have a dependency of 40%, as they can pivot to manual tasks or physical inspections. Assigning these percentages ensures your final figure is realistic rather than inflated. You should also adjust this factor for “degraded” performance. If the systems are slow rather than down, you might apply a 20% dependency factor to represent the efficiency lost to lag and technical friction.
Beyond the Spreadsheet: Factoring in Intangible Costs and Momentum
While the formulas in the previous section provide a solid financial baseline, they don’t capture the full picture. For many New Zealand managers, the most damaging effects of technical friction are the ones that don’t appear on a balance sheet. These “soft” costs include the erosion of departmental synergy and the loss of strategic focus. When you consider how to calculate productivity loss from IT issues, you must account for the ripple effect. A technical bottleneck in your finance team in Wellington doesn’t just slow down invoicing; it delays procurement, stalls projects, and eventually impacts your Auckland sales team’s ability to promise delivery dates.
There’s also the significant burden of opportunity cost. Every hour a senior leader spends troubleshooting a VPN or waiting for a legacy application to respond is an hour not spent on business growth. This creates a culture of “learned helplessness” where staff stop looking for innovative solutions because they expect the technology to fail them. Over time, this diminishes the overall agility of your organisation, making it harder to respond to market changes or competitor moves.
The Cost of Lost Momentum
Research from the University of California, Irvine, suggests that it takes an average of 23 minutes and 15 seconds to return to a task after a distraction. When technical glitches cause “micro-stalls” throughout the day, the cumulative effect on weekly output is staggering. These interruptions break the state of “flow” required for complex problem-solving and creative work. Momentum is a business asset that requires stable infrastructure to maintain, and once it’s lost, it costs more than just the minutes on the clock to get it back.
Reputational Damage and Client Trust
The hidden cost of technical friction often manifests in customer-facing interactions. We’ve all heard the phrase, “I’m sorry, our system is running a bit slow today.” While clients may be polite, these small moments of friction chip away at their confidence in your brand’s professionalism. If a system failure occurs during a high-stakes presentation or prevents a quick response to a query, it can derail contracts worth thousands of dollars. These incidents lead to a decrease in customer lifetime value that far outweighs the cost of a hardware upgrade or a proactive maintenance plan. Unreliable technology doesn’t just frustrate your staff; it eventually alienates the very people who fund your business.
Identifying the “Silent Killers” of Productivity in Your Organisation
While a major server crash is impossible to ignore, the most significant financial leaks often stem from “silent killers” that blend into the daily routine. These are the persistent technical frictions that managers often mistake for the inevitable cost of doing business. When you are looking at how to calculate productivity loss from IT issues, it’s essential to look beyond the helpdesk tickets and examine the underlying health of your infrastructure. Often, the most expensive IT strategy is one that relies on reactive “break-fix” support, where you only address problems after they have already halted your team’s progress.
Network bottlenecks and poor internet connectivity are classic examples of these hidden drains. In offices across Auckland and Christchurch, staff frequently lose minutes every hour to laggy cloud applications or slow file syncs. These micro-delays might seem trivial in isolation, but across a team of twenty, they represent hours of lost labour every week. Moving from a reactive model to a proactive partnership allows you to identify these bottlenecks before they impact your bottom line.
The Legacy Hardware Tax
Keeping a five-year-old laptop might seem like a prudent way to save on capital expenditure, but it often creates a hidden tax on your payroll. If a slower device adds just 10% to boot times and application loading throughout the day, that equates to roughly 45 minutes of lost productivity per person, per week. Based on the 2026 average NZ hourly wage of $44.20, that “free” old laptop is actually costing your business over $1,700 a year in wasted time. Regular hardware lifecycle management ensures your team has the tools to remain efficient while making your IT budget far more predictable.
Software and Workflow Inefficiencies
Inefficiency isn’t always about the hardware; often, it’s about how your team interacts with their software. Many New Zealand organisations suffer from “app sprawl”, where redundant subscriptions overlap and create confusing workflows. Even with powerful tools like Microsoft 365, productivity stalls if SharePoint isn’t structured correctly or if Teams is used as a chaotic dumping ground for files. You can Contact IT Works to discuss your Microsoft 365 environment to ensure your team is actually getting the most out of your existing investments. Without proper training on features like Microsoft Copilot, your staff may be manually performing tasks that could be automated in seconds. To stop these leaks and improve your operational efficiency, you should discuss your technology priorities with our team.
Strategic IT Management: Turning Technology into a Growth Engine
Once you understand how to calculate productivity loss from IT issues, the focus naturally shifts from measurement to mitigation. It’s no longer enough to simply know what you’re losing; the goal is to reclaim those hours and reinvest them into your core business objectives. Moving away from a reactive “break-fix” model toward a proactive partnership allows your organisation to treat technology as a strategic asset rather than an unpredictable expense. This shift is becoming the standard for successful Kiwi businesses, with a 2025 Datacom survey revealing that 68% of New Zealand companies plan to increase their tech investments to drive efficiency and growth.
Managed services provide a level of financial predictability that traditional support cannot match. Instead of facing spikes in expenditure when a server fails or a network drops out, you move to a fixed monthly model. This replaces the stress of technical management with a sense of calm reliability. When your infrastructure is stable, your team can stop fighting with their tools and start focusing on high-value work that actually moves the needle for your organisation. This transition builds resilience, ensuring your systems are ready to support the projected growth of New Zealand’s IT sector through to 2029.
The Value of Proactive Monitoring
Proactive monitoring is the first line of defence against the productivity leaks discussed earlier. By utilising 24/7 oversight, a strategic partner can identify a failing hard drive or a security vulnerability before it ever impacts an end user. This approach includes automated patching and regular updates, which are essential for maintaining continuity and protecting your data. If you want to understand how this model differs from traditional support, you can read our Guide to Managed IT Support for New Zealand Organisations. Catching issues early prevents the “micro-stalls” that silently erode your team’s momentum.
Building a Technology Roadmap for Future Growth
A technology roadmap acts as a compass for your business, aligning every dollar spent with your long-term goals. Rather than making isolated hardware purchases, a roadmap ensures that your infrastructure, software, and cybersecurity measures work together as a connected system. Having a strategic advisor who understands the specific challenges of the New Zealand business landscape is vital for ensuring a high return on investment. This partnership allows you to anticipate needs before they become urgent problems, turning your IT environment into a reliable engine for success. To begin aligning your tech with your business goals, Talk to IT Works about your technology strategy.
Reclaiming Your Organisation’s Strategic Potential
Quantifying the hidden costs of technical friction is the first step toward building a more resilient and efficient organisation. By mastering how to calculate productivity loss from IT issues, you’ve moved beyond anecdotal frustrations to a place of strategic clarity. You now have the tools to identify whether your primary bottlenecks are ageing hardware, inefficient workflows, or a reactive support model that only addresses problems after they’ve already caused damage. This data-driven approach allows you to present a clear business case for the investments that will truly drive your success.
The transition from “putting out fires” to proactive growth requires a steady hand and a clear vision. Our New Zealand-based advisory team specialises in replacing technical stress with calm reliability through proactive management and strategic IT roadmaps. This approach doesn’t just reduce recurring glitches; it ensures your technology spend remains predictable and aligned with your long-term business goals. When your team is empowered by reliable systems, they can focus their energy on the work that actually creates value. If you’re ready to move away from technical friction and toward a more purposeful future, you can speak with our team about improving productivity and security. We’re here to help you turn your technology into a genuine engine for growth.
Frequently Asked Questions
How do I calculate the hourly cost of an employee for productivity loss?
You should use a “loaded” hourly rate rather than a base salary to get an accurate figure. This includes the employee’s gross wage plus Kiwisaver contributions, insurance, and office overheads like rent and utilities. For a credible result, start with the 2026 average New Zealand hourly wage of $44.20 and add your specific overhead multiplier to see the true cost of an idle staff member.
What is a “normal” amount of IT downtime for a New Zealand business?
There is no single “normal” amount, but losing one to five hours per week is a common benchmark for many organisations. While total system blackouts are rare, “soft downtime” like slow loading times and minor glitches often goes unnoticed by management. Your goal should be to reduce these micro-stalls through proactive monitoring so that technology remains a silent enabler rather than a constant distraction.
Can I include lost sales in my productivity loss calculation?
Yes, you can and should include lost sales if the IT issue directly prevents your team from closing deals or processing orders. While the labour cost calculation focuses on internal wastage, revenue loss accounts for the external impact on your bottom line. Combining these two figures provides a more comprehensive view of how to calculate productivity loss from IT issues when presenting to your executive team.
How does proactive IT support actually reduce productivity loss?
Proactive support reduces loss by resolving technical bottlenecks before they result in staff downtime. Instead of waiting for a component to fail, a strategic partner uses 24/7 monitoring to identify early warning signs like failing hard drives or network congestion. This allows for maintenance to be scheduled outside of business hours, ensuring your team stays focused on their primary tasks without interruption.
Is it worth upgrading old hardware if it still technically works?
It is almost always worth upgrading hardware older than four or five years because the hidden costs of lag outweigh the capital expenditure. Even a device that “works” might be 10% slower than a modern equivalent, which wastes nearly an hour of labour every week. When you multiply that lost time by an employee’s loaded hourly rate, the cost of keeping old gear becomes significantly higher than a new purchase.
What are the most common causes of hidden productivity loss in NZ offices?
In many New Zealand offices, the primary culprits are slow network connectivity, outdated hardware, and “app sprawl”. Redundant software subscriptions often lead to confusing workflows where staff waste time switching between different platforms. Additionally, a lack of structured training on tools like Microsoft 365 means that employees often use manual workarounds for tasks that could be easily automated.
How do I present these productivity loss figures to my board or director?
You should present these figures as a clear dollar value that represents a missed opportunity for business growth. Instead of focusing on technical jargon, show the board how much labour budget is being “taxed” by inefficient systems. Use the formulas provided in this guide to demonstrate the potential ROI of a proactive IT strategy, focusing on how improved reliability will lead to better staff retention and customer satisfaction.
Does Microsoft 365 help reduce productivity loss?
Microsoft 365 is an excellent tool for reducing productivity loss, provided it is configured to suit your specific business workflows. When SharePoint and Teams are structured correctly, they eliminate the time wasted searching for files or managing messy email chains. Tools like Microsoft Copilot can also automate repetitive tasks, allowing your team to focus on higher-value work that contributes to your organisation’s long-term success.